Fig. 1: Example of Security Diagram
Table of Contents
Although climate impact analysis up to now has focused mostly on the impacts of gradual changes in climate, it is also clear that extreme, infrequent climate events (e.g. droughts and rainy periods) can have important impacts on society. One new method to research the risks of extreme climate events is the "Security Diagram" which aims to couple climate-related "environmental stress" with the susceptibility of states and the occurrence of "crises" (Alcamo, 2000; and Alcamo and Endejan, 1999).
Fig. 1: Example of Security Diagram
Figure 1 shows an example of a Security Diagram. Every data point in this diagram depicts the environmental stress and corresponding susceptibility of a particular geographic region for a particular time period, usually one year. Some of these data points are shaded gray which indicates that an environmentally-related crisis occurred when the environmental stress and susceptibility were at this level. In theory a Security Diagram can depict any type of environmental stress and any type of crisis. For example Alcamo and Endejan (1999) show Security Diagram which depict both food and water crises. But in this project we will focus on drought as the extreme climate event which causes environmental stress, and water shortages as the resulting crisis.
The assumption behind the Security Diagram is that the higher the environmental stress, the higher the likelihood of crises. At the same time, the higher the state susceptibility (and the lower the adaptation capacity), the lower the stress required to cause a crisis. Hence, we expect that the occurrence of crises would be crowded into the right and upper right of the diagram, as illustrated in the hypothetical diagram in Figure 1. This is an important aspect of the Security Diagram - rather than projecting that a climate impact will occur, a Security Diagram estimates the probability of occurrence. Figure 1 illustrates that a high probability and low probability boundary can be defined.
A security diagram requires three key inputs
An important question is, how can we define these inputs? Unfortunately, there is no objective method to define them and all three inputs are interpreted differently by different scientific disciplines. But in order to illustrate the concept of Security Diagrams, Alcamo (2000) and Alcamo and Endejan (1999) went ahead and pragmatically assigned very provisional values to these inputs:
Significance and limitations of Security Diagrams?
The advantages of Security Diagrams are that :
But Security Diagrams also have limitations - first of all such an approach can never substitute for detailed studies of risk and adaptation in different countries or regions, nor can it provide enough information for designing detailed adaptation strategies. Another major deficiency, and perhaps the most important, is that the three concepts on which it is based (stress, susceptibility and crisis) are not well-defined and do not take full advantage of relevant research in the social sciences. In this project, we propose to focus on this deficiency. We aim to improve these definitions by analyzing data from case study regions and drawing on knowledge from the social sciences. In this way the Security Diagram can become a more useful tool for assessing risk of extreme climate events.
The main objective of this project is to improve the computations of Security Diagrams by improving the definitions of the three inputs to these diagrams - environmental stress, susceptibility and environmental crisis.
This improvement will come from the analysis of data from three case study regions in the light of knowledge from social and natural science. We will focus on climate-related water shortages, although results from this project are expected to be applicable to other problems such as flooding and food shortages. We will also focus on case study regions with the aim to generalize information from them to other parts of the world. Another objective of this project is to bridge the gap between scientifically oriented climate impact community and the policy-oriented community concerned with "environment and security".
One important challenge to improving the concepts of environmental stress, susceptibility and crisis is that different disciplines have a different definition and perspective about these concepts. In this project we will specifically examine these concepts from different perspectives. For the purposes of this project we aggregate the many different disciplinary perspectives into two main types - the top-down perspective and the bottom-up perspective:
Potential Application and Policy Relevance of Security Diagrams |
An Example of the Application of Security Diagrams. Because Security Diagrams bring together the concepts of environmental stress, susceptibility, and crisis, they can be useful tools for global risk assessment in various policy applications. To illustrate their use, we present the following example from Alcamo et. al (2000a). First environmental stress and susceptibility is computed for each country and each year as specified above in Section 1.2. These data are used with a Security Diagram such as the one in Figure 2 to compute the relative number of years in which each country had a high potential of water crisis between 1901 to 1995. The result is a map (Figure 2) which shows that 23 countries are computed to have a high potential for water crisis during 50% or more of these years. In the next highest category were countries such as India, China and Mexico. All in all, the countries computed to have frequent potential for crisis are those countries who in reality had ongoing water shortages during the 20th century.
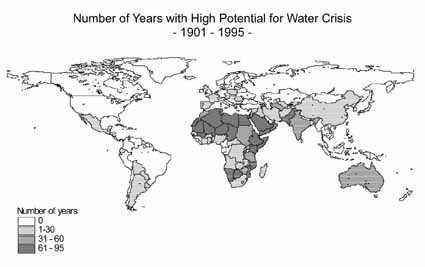
Fig. 2: Application of Security Diagrams
Source: Alcamo et. al., 2000a.
Next, Alcamo et. al (2000a) estimated the change in risk because of growing national income and climate change (Figure 3). It was noted that the number of countries in the highest risk category drops to 19, but some new countries such as South Africa and Australia now belong to this category. This is because these countries have drier climates according to the climate change scenario used in this example. Some countries such as China and India are computed to have a lower potential for crisis. This also stems from the climate scenario which shows an increase in precipitation in most parts of these countries. Moreover, this scenario assumes continued economic growth in these countries which the preliminary Security Diagram interprets as a reduction of their susceptibility to crisis.
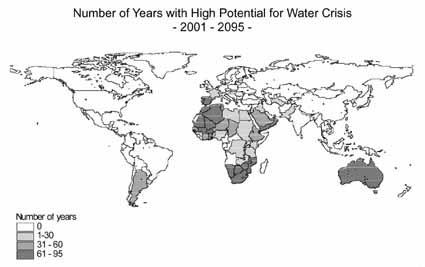
Fig. 3: Application of Security Diagrams
Source: Alcamo et. al., 2000a.
Potential Applications: Although the previous example is only presented for illustration, it does suggest a range of possible applications for Security Diagrams. For example:
To contribute to international assessments of impacts of climate change.
To provide water resource planners with a long time perspective as to the possible regions of the world where water resources may be particularly sensitive to various climate change scenarios.
To help set priorities for foreign aid by pointing out where water shortages may hinder development in developing countries.
To provide international emergency organizations with information about future "hot spot areas" of water shortages.
This is one of the few projects that makes an explicit and quantitative link between extreme climate events, susceptibility of society, and crises for different regions.
This project is very unique in its investigation of environmental stress, susceptibility and crisis from two distinct social science perspectives.
This project is unique in the links it makes between hydrology, political science, psychology, and other disciplines
This project is unique in the bridge it makes between the climate impact community and the research community concerned with environment and security
Alcamo, J. and Endejan, M., Kaspar, F., Rösch, T. 2000a. The GLASS model: a concept for global modeling of environmental security. Environmental Science and Policy.
Alcamo, J. Döll, P., Henrichs, T., Kaspar, F., Lehner, B., Siebert S. 2000b. WaterGAP 2: A model for global assessment of water resources. Water Resources Research.
Alcamo, J. 2000c. Environment, security, and the question of quantification, Accepted for publication in International Journal of Sustainability, and previously published in Dutch in: Kok, M., de Groot, W. (eds.). 1999. A climate for change. Jan van Arkal Publishing: Utrecht, NL. pp. 147-170.
Alcamo, J. and Endejan, M. 1999. The security diagram: An approach to quantifying global environmental security. Proceedings of NATO Advance Research Workshop on "Responding to environmental conflicts: implications for theory and practice." Budapest, Hungary. 21-23 January, 1999
Döll, P., Kaspar, F. Alcamo, J. 1999. Computation of global water availability and water use at the scale of large drainage basins. Mathematische Geologie, 4: 115-122.
CRED (Center for research on the epidemiology of disasters), Universite Catholique de Louvain, Belgium. 1998. http://www.md.ucl.ac.be/entites/esp/epid/misson/projet_uk.htm
Back